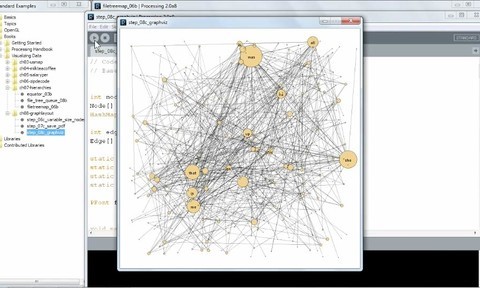
Start communicating ideas and diagramming data in a more interactive way. In this course, author Barton Poulson shows how to read, map, and illustrate data with Processing, an open-source drawing and development environment. On top of a solid introduction to Processing itself, this course investigates methods for obtaining and preparing data, designing for data visualization, and building an interactive experience out of a design. When your visualization is complete, explore the options for sharing your work, whether uploading it to specialized websites, embedding the visualizations in your own web pages, or even creating a desktop or Android app for your work.
Login to LinkedIn Learning

